Flying Blind: Why Most Organizations Are Running on Half the Picture
August 7, 2026
You wouldn't make a treatment decision without checking a patient's vital signs. So why make business decisions without a clear view of your organization's financial health?
Too often, the insights leaders need are scattered across dozens of reports, buried in spreadsheets, or outdated by the time they're reviewed. The result? Decisions are made with incomplete information, and opportunities to improve revenue, productivity, and patient access are easily overlooked.
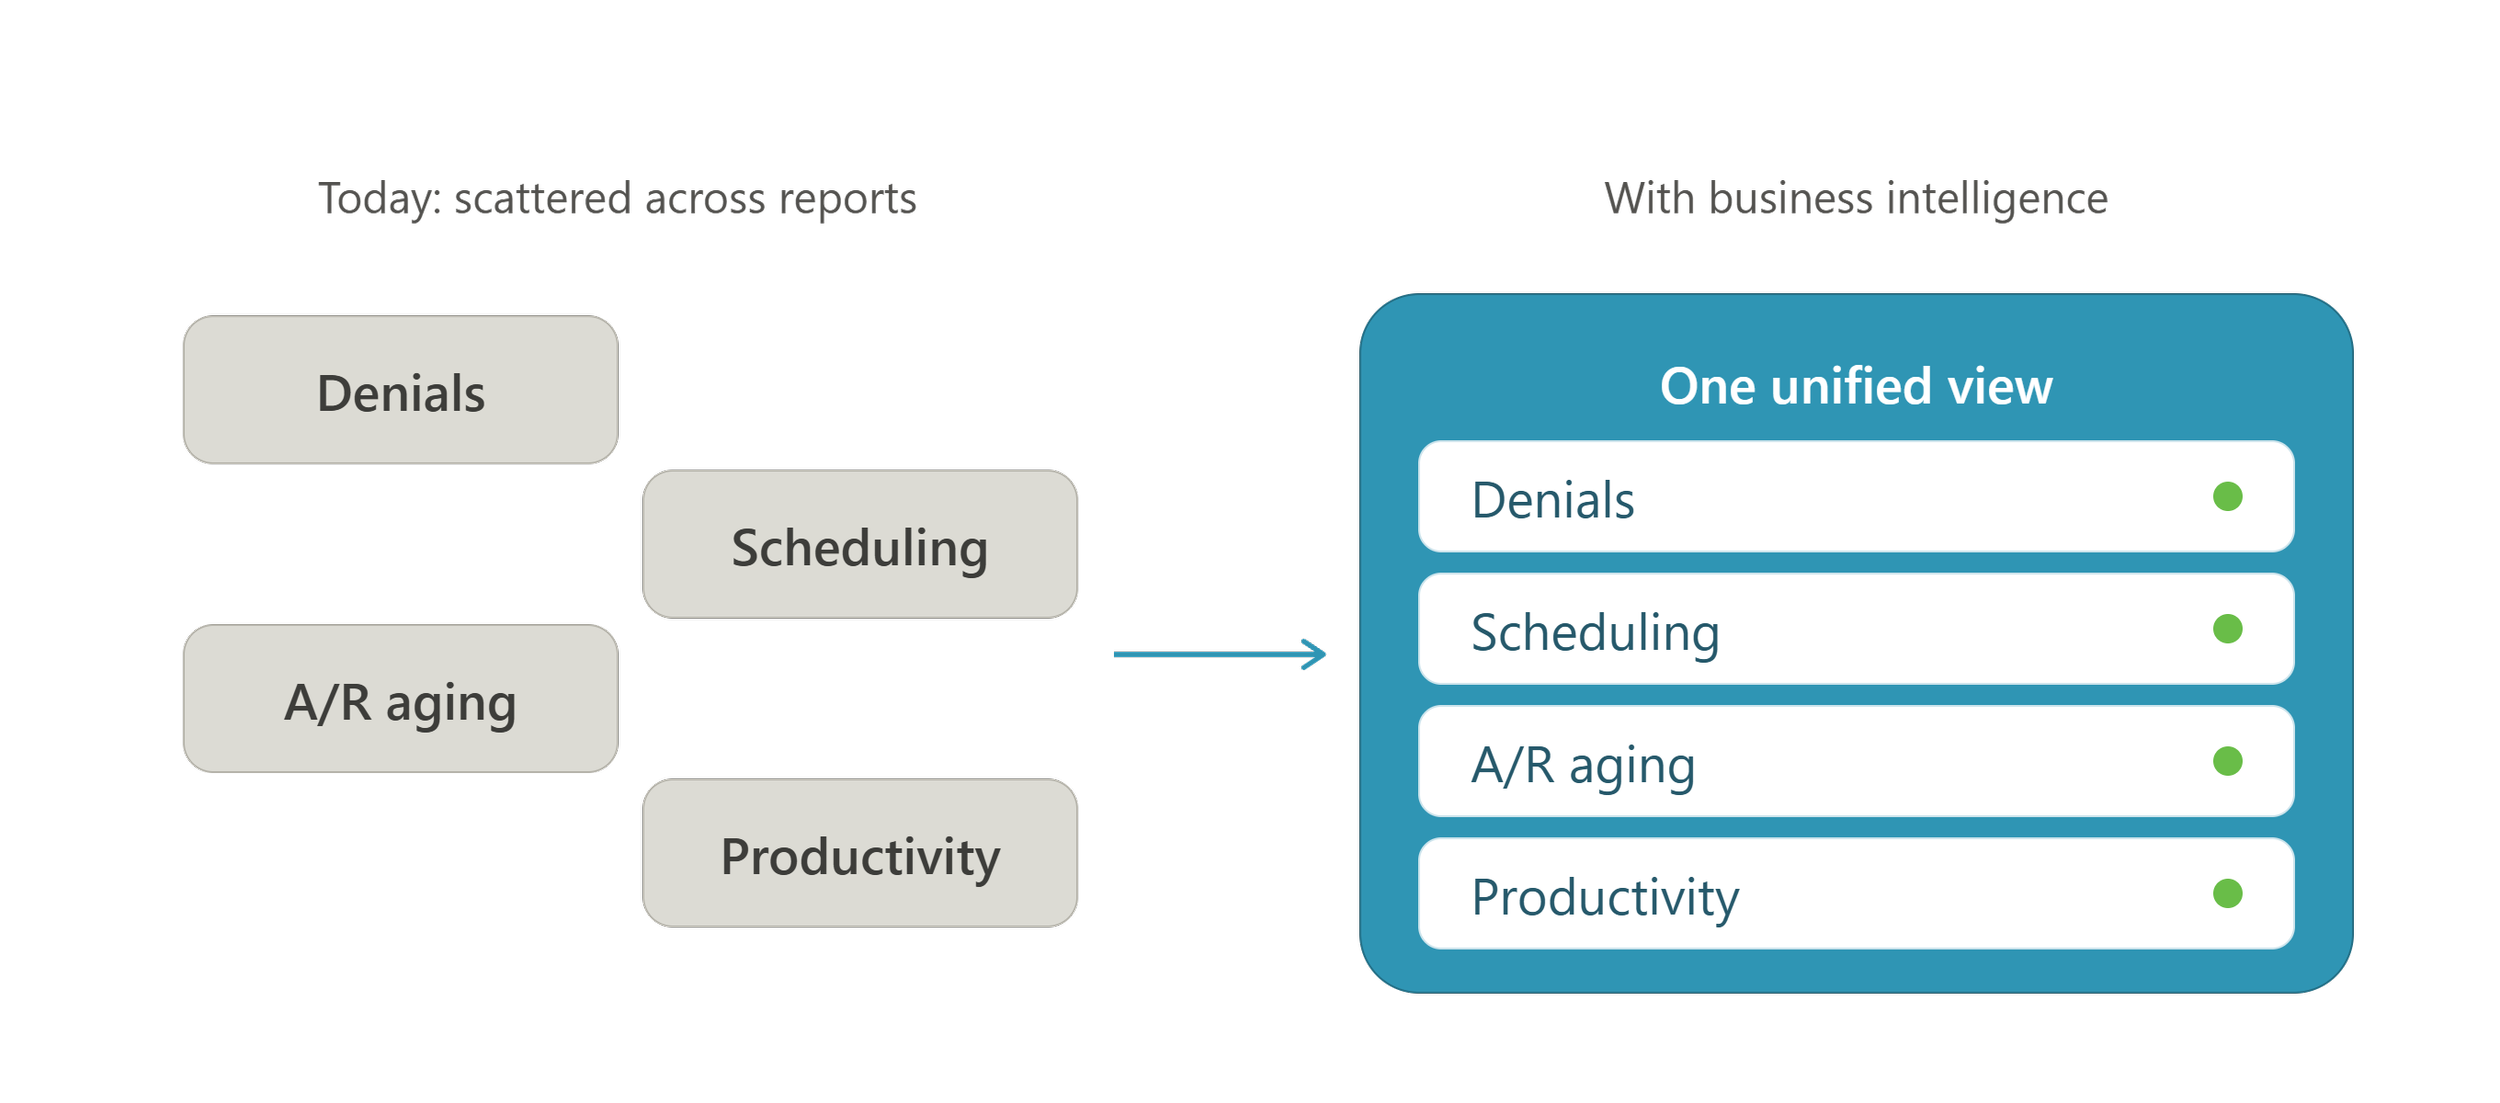
This is where healthcare business intelligence earns its keep, and it’s about far more than billing. The blind spots show up across the whole organization; denials in one report, the appointment schedule in another, staff productivity somewhere else, and aging A/R in a fourth. Each piece lives in its own silo, and stitching them into a single picture tends to mean hours in reports and spreadsheets nobody wants to manage. That gap, between having data and having answers, is where money quietly leaks.
How much does it cost to rework a denied claim?
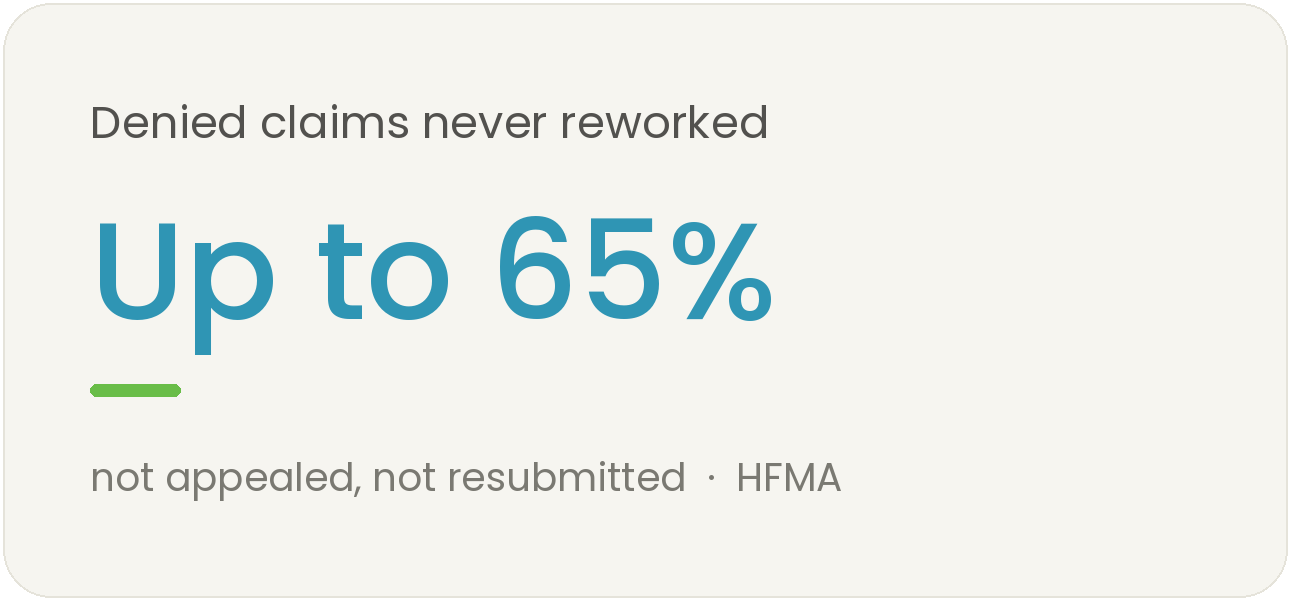
It costs more than most teams realize. Recent national survey data put the average cost to fight a denied claim jumped almost $14 per claim in 2023 alone. And that's only the claims you actually pursue. Up to 65% of denied claims are never reworked at all; not appealed, not resubmitted, just abandoned. Every one of those is rightfully earned revenue you walked away from, and when you can't see denial trends clearly and early, that quietly becomes a very expensive blind spot.
What's a good claim denial rate?
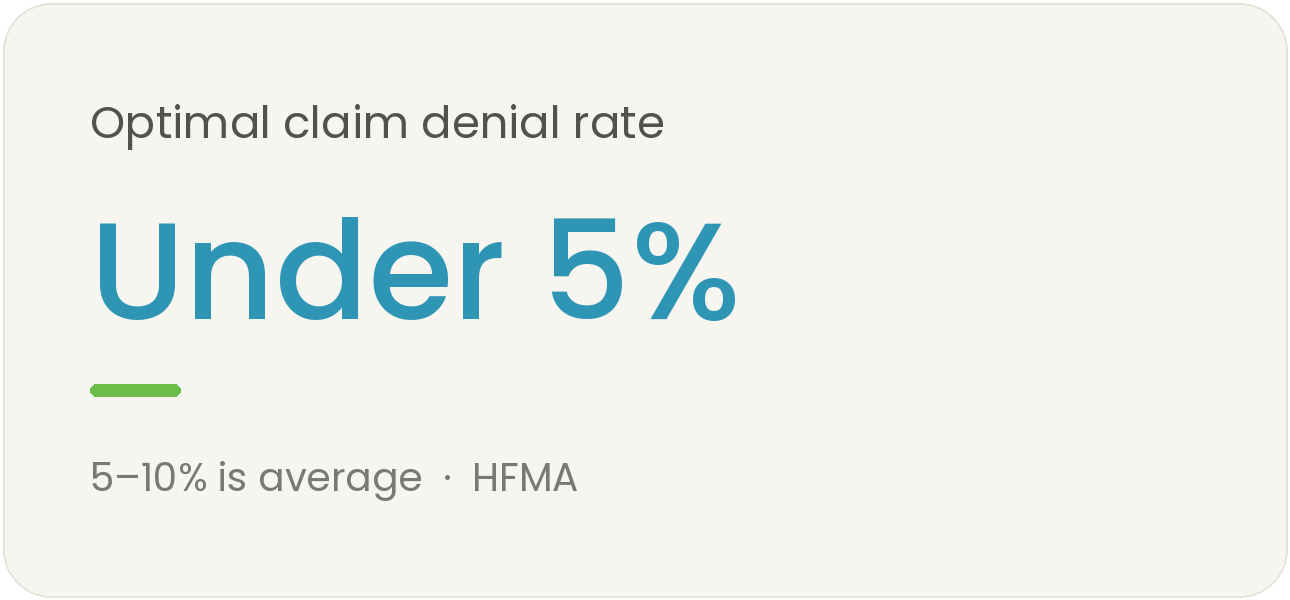
The industry average denial rate runs between 5% and 10%, with under 5% considered optimal. Simple enough on paper, right? The catch is that most organizations can't tell you their current rate without building a report first, let alone whether it spiked last week or which payer is the biggest culprit. Time spent digging to find a number is time spent not managing the process.
How do you reduce patient no-shows?
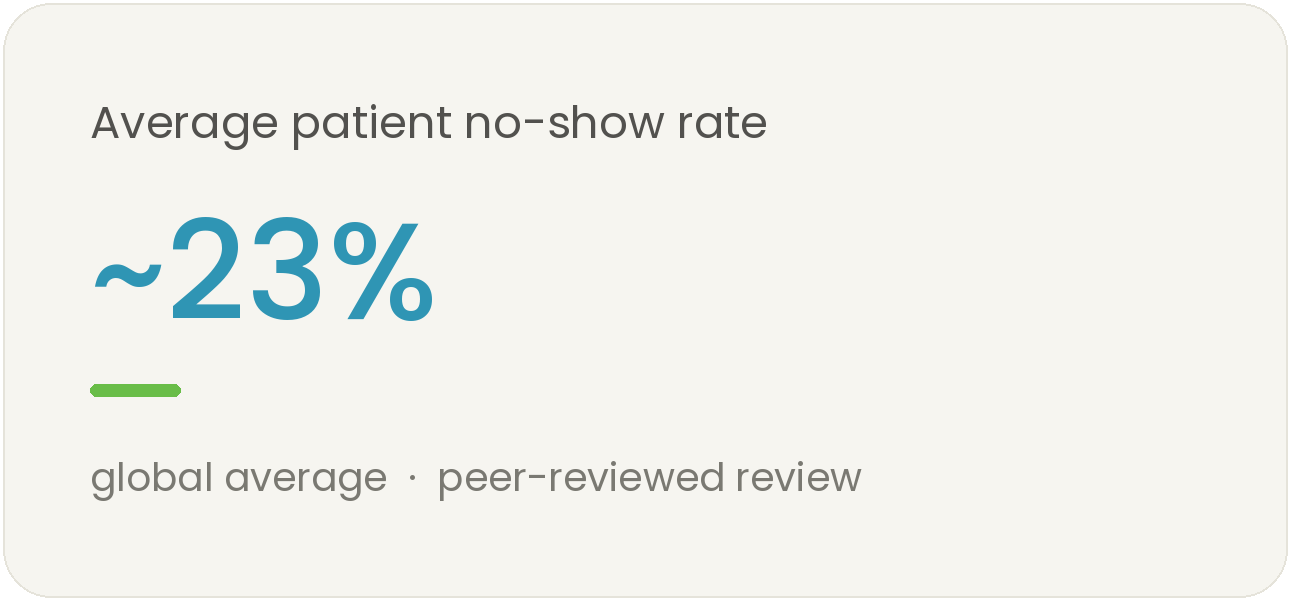
It starts with seeing them clearly. No-shows are common. The global average no-show rate sits around 23%. Everyone knows that no-shows hurt, but few can say what they actually cost their schedule, this month, in real dollars. How can you fix what you can't even quantify? Reminder systems help solve the problem, but the first move is putting a hard number on the empty chair, so you know where and how much it's actually bleeding.
Which KPIs should you track in your revenue cycle?
The ones that turn billing from a mystery box into something you can steer. The HFMA (Healthcare Financial Management Association) points to a core set of metrics, including net and gross collection rates, clean claim rate, days in A/R, and your denial and resolution rates. The trouble is that these usually live in separate places, so seeing them together is the tricky part.
What changes when you can actually see

Business intelligence has one simple goal: to move you from reporting on the past to managing the present.
Instead of pulling a report to see what happened last month in a snapshot, you're looking at where things stand right now, across every function, in one place. Instead of a hunch that one payer drives most of your denials, you have a ranked list. Instead of wondering whether claims are going out the door fast enough, you can see output by user and intervene where necessary.
It's not about surveillance or micromanaging. It's about giving your financial operations the same clarity you already expect from your clinical ones. Something quiet happens, too: decisions get easier. You stop re-litigating what the numbers say in every meeting. You know the trends and realities, and you act.
A few questions worth asking about your own organization
Every practice and billing company sits in a different place with its data. These tend to reveal where the gaps are:
Could you see, right now, which payers generate the most revenue per visit? Which are quietly underperforming? If it takes 45 minutes to answer, that's worth noting.
Do you know what percentage of copays your front desk actually collects at the time of service? It's a frequently overlooked revenue lever.
If denials spiked last week, would you know today or in 30 days when the monthly report lands?
What did no-shows cost you in real dollars last month? Not just the number of appointments missed, do you know the estimated lost revenue?
Can you tell who on your team is the “clean claim master” versus who could use a little support? Can you back this up with hard data?
If any of these questions sends you digging through multiple reports, that's the visibility gap in action.
The real edge isn't more data
Data has never been the challenge. Turning it into actionable insight is. The organizations pulling ahead aren't the ones with more information. They're the ones who can find it fast, read it without a data analyst in the room, and act decisively before small problems get expensive.
If you're already an OpenPM user, this enhanced visibility may already be waiting in the platform you use every day. The Business Intelligence dashboards bring your RCM, scheduling, A/R, and productivity data into neat and easily digestible dashboards. If you're still weighing your options on new practice management software, ask this: Can my software show the whole picture, or just one piece at a time?